The arrival of the 38th America’s Cup cycle in Naples places the Gulf at the centre of one of the most technologically advanced sailing competitions in the world. In this context, the marine and atmospheric environment is not merely a background condition. It is part of the system in which sporting performance, operational decisions, scientific observation and public engagement take place.
For this reason, meteo@uniparthenope, the weather and ocean forecasting service of the University of Naples “Parthenope”, contributes to the AC38 context by making available high-resolution atmospheric, wave and marine circulation forecasts for the Bay of Naples, together with real-time observations from a local weather-station network.
The objective is broader than the publication of conventional weather maps. The service is conceived as an open environmental information infrastructure: a system in which numerical models, observations, visual products and machine-readable datasets coexist and can be used at different levels of complexity by sailing teams, event organizations, researchers, developers, marine operators and spectators.
At the centre of this approach is a simple principle:
meteo@uniparthenope produces numbers, not just icons.
The graphical products available through the web portal are therefore best understood as one possible representation of a much richer numerical information space. The same forecast fields can be inspected visually, downloaded, queried programmatically, incorporated into custom models, integrated into independent visualization systems or compared directly with in situ observations.
Reading the Bay as a coupled environmental system
A useful entry point for AC38-related activities is the dedicated Baia di Napoli forecasting interface.
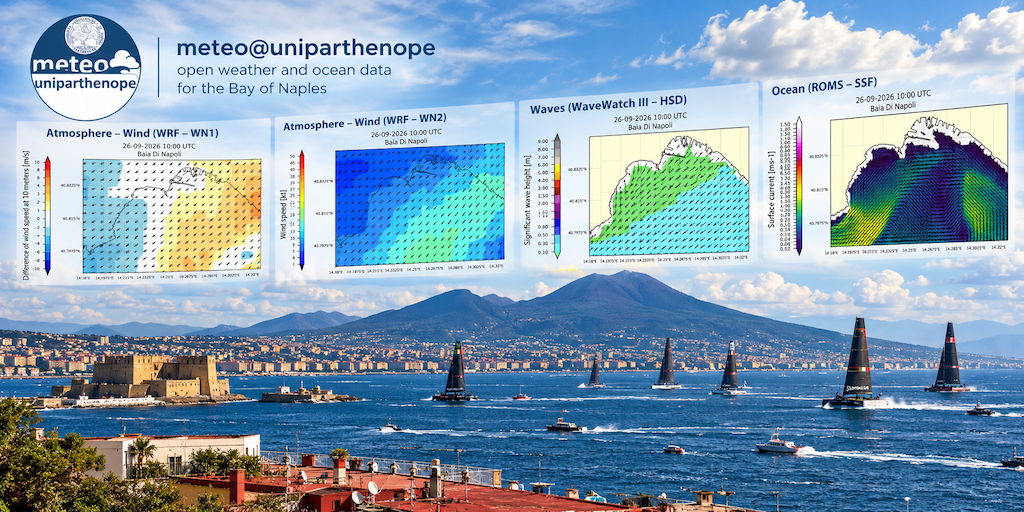
The four dashboards considered here should not be interpreted as independent weather products. They represent different components of a coupled atmosphere–wave–ocean system, and their scientific value emerges most clearly when they are read together.
The first two dashboards are generated from the Weather Research and Forecasting model, WRF, and provide complementary high-resolution representations of the wind field over the Bay of Naples:
Wind speed at 10 meters in knots
For sailing applications, the interest of these products does not lie only in obtaining a representative wind speed at a given point. The more relevant information is contained in the spatial structure of the atmospheric flow.
The Bay of Naples is characterized by a complex coastline, steep coastal orography, islands, urbanized shorelines and strong land–sea interactions. These features can produce significant spatial variability in near-surface wind conditions. A single point value is therefore necessarily incomplete.
The WRF dashboards make it possible to examine how the wind field is organized across the entire area and how that organization evolves through forecast time. Local accelerations, directional changes, coastal gradients and mesoscale structures become visible as part of a coherent field rather than as isolated measurements.
For sailing teams, this information can complement internal meteorological analysis. For race and event organizations, it provides a wider environmental context for operations on the water. For researchers and students, it offers an immediately accessible example of atmospheric modelling over a highly complex coastal domain. For spectators, it provides a direct way to understand why conditions experienced by boats in different parts of the Bay may differ even within the same race.
The third dashboard introduces the wave component of the system:
Significative wave height and direction
This product derives from WaveWatch III, a third-generation spectral wave model. It adds information that cannot be inferred from wind conditions alone.
The sea state reflects both present and preceding atmospheric forcing. In other words, the wave field has a dynamical memory. Similar instantaneous wind conditions may therefore correspond to different wave environments, depending on the history and spatial distribution of the forcing.
The HSD product should consequently be interpreted as a second environmental layer, complementary to the atmospheric forecast. By moving through forecast time, users can examine how significant wave conditions evolve across the Bay and how the wave field responds to changing meteorological forcing.
This distinction is especially important in sailing. Boats do not interact with wind in isolation: they move within a coupled air–sea environment in which waves can affect performance, maneuverability, comfort, support operations and safety.
The fourth dashboard extends the analysis below the surface:
Surface current in meters per second
This product is based on the Regional Ocean Modeling System, ROMS, and provides a representation of surface ocean circulation.
In a high-performance sailing context, coastal currents may be weaker than the dominant atmospheric forcing, yet they remain physically relevant because they contribute to the velocity of the water mass relative to the boat. Their spatial organization, persistence and temporal variability can therefore become part of the broader interpretation of the race environment.
The ROMS dashboard makes it possible to inspect how the coastal circulation is structured across the Bay and how it changes through time. It should be considered together with the atmospheric and wave products, rather than as a separate oceanographic curiosity.
The resulting picture is a coupled one: the atmosphere forces the surface ocean, the wave field responds to the wind, the coastal circulation evolves under multiple dynamical influences, and all these components coexist within the same geographical domain.
This is the physical system in which the competition takes place.
From visualization to numerical information
The web dashboards are intentionally accessible. They allow a user to move through forecast times, compare variables and inspect the spatial evolution of the environment without requiring specialist software.
However, their scientific and technological significance lies in the fact that the maps are only the visible layer of the service.
The underlying information is available through the open-data infrastructure at:
https://meteo.uniparthenope.it/data/
The distinction is fundamental.
A conventional weather application usually presents a finished visual interpretation: an icon, a colour, a symbol, perhaps a value associated with a location.
A numerical forecasting service produces something different. It produces fields: structured arrays of values defined in space and time, associated with physical variables and generated by numerical models.
These fields are reusable.
They can become inputs to additional algorithms.
They can be interrogated at arbitrary locations.
They can be compared with observations.
They can be combined with vessel telemetry, geographical information, scientific models or external datasets.
They can be transformed into entirely new representations.
This is why the emphasis on open data is not secondary to the meteo@uniparthenope service. It is one of its defining characteristics.
The data portal provides access mechanisms intended both for scientific use and for integration into external applications. Depending on the product, users can work with formats and services such as NetCDF, GRIB, OPeNDAP, APIs and geospatial web services.
This allows a team, a research group or an independent developer to move beyond the visual interface and work directly with the forecast values.
In this sense, meteo@uniparthenope does not prescribe a single interpretation of its data.
It provides the numerical basis from which other interpretations can be constructed.
A team may integrate the forecasts into an internal performance model.
A researcher may compare numerical forecasts with observations.
A developer may build a new visualization platform.
A routing system may extract wind, wave and current information along hypothetical trajectories.
A scientific workflow may evaluate forecast error or study the interaction between mesoscale wind structures and coastal circulation.
The same open dataset can therefore support operational, scientific, educational and technological uses.
Numbers as scientific objects
The phrase “numbers, not just icons” expresses this distinction in its simplest form.
An icon is a communication device.
A numerical field is a scientific object.
It has coordinates, units, temporal validity, spatial resolution, physical meaning and uncertainty. It can be transformed, analysed, compared and combined.
For the America’s Cup, this difference is especially relevant because modern sailing is already profoundly data-driven.
Boat performance is measured continuously. Navigation systems process large quantities of information. Engineering decisions are supported by numerical modelling. Meteorological teams combine observations and forecasts. Race management relies on environmental awareness.
Within such a context, open numerical weather and ocean data can become part of a broader ecosystem of analysis rather than remaining confined to a web page.
This is also the reason why the meteo@uniparthenope products should not be interpreted as deterministic statements about the future.
They are numerical model outputs.
Their value lies in the physical consistency of the modelling system, in their spatial and temporal resolution, in their accessibility and in the possibility of comparing them with observations and other information sources.
The observational counterpart: the weather-station network
Numerical prediction provides a representation of what the atmospheric and marine system is expected to do.
Observation provides information about what is actually being measured at a particular place and time.
The two components are complementary.
The real-time observational infrastructure is available through:
https://network.meteo.uniparthenope.it
For the Bay of Naples, four stations are particularly relevant to the geographical context of AC38 activities:
Villa Doria d’Angri
https://network.meteo.uniparthenope.it/public/station/it.uniparthenope.meteo.ws7
Via Acton
https://network.meteo.uniparthenope.it/public/station/it.uniparthenope.meteo.ws6
Gaiola
https://network.meteo.uniparthenope.it/public/station/it.uniparthenope.meteo.ws2
Città della Scienza
https://network.meteo.uniparthenope.it/public/station/it.uniparthenope.meteo.ws3
These stations provide observational reference points distributed along different sectors of the Naples coastline.
Their role should be understood correctly.
A weather station measures the atmosphere locally. It does not describe the entire Bay.
A numerical model, in contrast, provides a spatially continuous representation of the atmospheric field, but that representation remains a simulation.
Using forecasts and observations together therefore provides a more complete basis for interpretation than relying on either source in isolation.
For example, one may inspect the predicted spatial wind field from WRF and then compare the temporal evolution of that forecast with observations from Gaiola, Villa Doria d’Angri, Via Acton or Città della Scienza.
Such comparisons can help users understand how well local conditions correspond to the broader modelled pattern.
They also provide an important scientific and educational perspective: modern environmental prediction is built on the continuous relationship between models and observations.
A practical consideration is equally important. Real-time observations must always be interpreted together with their timestamp. The freshness of the latest available measurement is part of the data itself.
A common information space for different communities
One of the strengths of an open forecasting infrastructure is that the same environmental information can support communities with very different levels of technical specialization.
For sailing teams, the dashboards can serve as a rapid visual reference, while the open numerical datasets can support deeper integration into internal analytical systems.
For event organizations and marine operators, the combined atmospheric, wave and ocean products provide a broader view of the evolving environmental conditions over the Bay.
For researchers, the AC38 period provides a particularly interesting case study in which high-resolution models, real-time observations and intensive marine activity coexist within a relatively compact coastal domain.
For students, the same infrastructure transforms an internationally visible sporting event into an opportunity to observe applied atmospheric and ocean modelling in a real geographical setting.
For developers, the availability of machine-readable data creates the possibility of building independent services, dashboards, data-processing workflows and experimental decision-support tools.
For spectators, the dashboards provide a way to look beyond the simple concept of “good weather” or “bad weather” and to appreciate the spatial complexity of the environment in which the races are taking place.
These are not separate uses of the same system.
They are different levels of access to the same physical information.
The Bay of Naples as a natural laboratory
The America’s Cup has always been closely associated with innovation.
The boats themselves are the visible expression of this relationship between sport, engineering, physics and computation.
But the environment in which they operate is equally rich from a scientific perspective.
The Bay of Naples is a complex coastal system in which atmospheric circulation, topography, land–sea interaction, waves and marine currents interact over relatively short spatial scales.
During AC38, this environment becomes simultaneously a racecourse, an operational space and a natural laboratory.
The role of meteo@uniparthenope is therefore not to provide a single authoritative interpretation of conditions, but to make high-resolution environmental information openly available so that different users can interpret, analyse and reuse it according to their own needs.
The dashboards provide access to the visual structure of the forecast.
The open-data infrastructure provides access to the underlying numbers.
The weather-station network provides the observational counterpart.
Together, these elements form a coherent environmental information system for the Bay of Naples.
Welcome to Naples
As the America’s Cup community arrives in Naples, meteo@uniparthenope contributes with what a university-based forecasting service can offer most effectively: scientific models, observations, open data and reproducible access to environmental information.
The invitation is therefore not simply to consult a forecast.
It is to explore the physical system in which the event takes place.
Look at how the wind field evolves across the Bay.
Compare it with the wave environment.
Add the surface circulation.
Relate the forecast to real-time observations.
And, when the visual products are no longer enough, access the underlying numerical data and build your own analysis.
Because in a modern scientific forecasting infrastructure, a map is only the beginning.
The real product is the data behind it.
Welcome to Naples.
Welcome to the Bay of Naples.
And welcome to an open, data-driven view of its atmosphere and sea.