Choosing a beach is often a matter of habit, accessibility, scenery, and reputation. The Blue Flag can provide a valuable starting point: it is an internationally recognized environmental award based not only on bathing-water quality, but also on environmental management, information, safety, services, and accessibility. It is therefore an important indicator of the overall quality and sustainability of a coastal destination.
However, conditions at sea are dynamic. Currents, wind, coastal circulation, river discharges, outfalls, and other sources can influence how substances are transported over periods of hours or days. A beach that generally offers excellent conditions may experience a temporary change, while another location may benefit from circulation that carries potentially polluted water away from the coast.
The operational output of WaComM++, the Water Quality Community Model in C++, can add this dynamic perspective when planning a day at the seaside.
From environmental recognition to daily marine forecasts
The Blue Flag reflects compliance with a broad set of environmental and management requirements. It is awarded annually and should not be interpreted as a real-time forecast for a particular hour or swimming location. WaComM++ addresses a different question:
Given the predicted marine circulation and the modeled pollutant sources, where are the simulated particles expected to travel during the next several hours?
WaComM++ is a high-performance Lagrangian transport and diffusion model developed and operated by the Center for Monitoring and Modelling Marine and Atmospheric Applications of the University of Naples “Parthenope.” It represents pollutants as inert particles and predicts their movement within three-dimensional marine-current fields.
The model does not replace the official classification of bathing waters, microbiological sampling, temporary bathing prohibitions, municipal notices, or the Blue Flag programme. Instead, it provides an additional forecast layer that can help users interpret how coastal circulation may affect different areas during the day.
What does the WaComM++ map show?
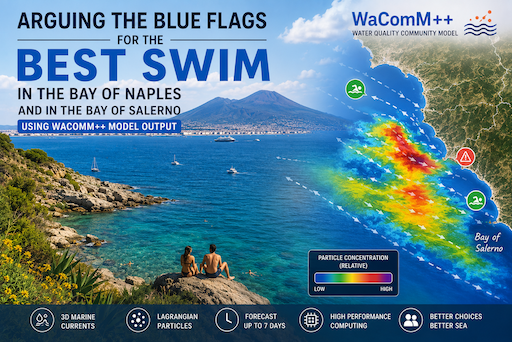
The WaComM++ operational product displays the modeled distribution and concentration of passive particles in the marine environment. These particles are transported by currents and dispersed through a stochastic diffusion process.
The model is driven by three-dimensional hydrodynamic information, including:
- eastward, northward, and vertical current components;
- sea-surface elevation;
- vertical diffusivity;
- bathymetry and coastal boundaries.
For each particle, WaComM++ calculates a deterministic displacement caused by the forecast current and a random displacement representing unresolved turbulent diffusion. The particle position is repeatedly checked against the sea surface, seabed, and coastline. Because particles move independently, millions of trajectories can be computed efficiently using MPI, OpenMP, and CUDA-enabled GPUs.
The resulting maps do not directly report a laboratory measurement of bacterial or chemical contamination. They show where particles emitted from the configured sources are expected to accumulate, disperse, or be transported.
How to consult the forecast
Open the Golfo di Napoli product page and select the WaComM++ product identified as wcm3. The interface allows users to choose the forecast date and time, display maps or charts, and explore forecast periods from a few hours to seven days. All displayed times are in UTC.
When planning a swim:
- Select the intended date and time.
Remember that the portal uses UTC. During Italian summer time, local time is two hours ahead of UTC. For example, a map valid at 08:00 UTC corresponds to 10:00 local summer time. - Examine more than one forecast frame.
A single map is only a snapshot. Review the hours before and after the planned swim to understand whether a particle plume is approaching, moving away, spreading, or remaining stationary. - Locate the intended coastal area.
Compare the particle distribution near the beaches or stretches of coast under consideration. - Prefer areas away from modeled concentrations.
White or particle-free areas indicate that the configured passive tracers are not present there at a visible modeled concentration. Areas with increasingly dense or elevated concentrations deserve greater caution. - Check the wider circulation pattern.
Do not look only at the exact point where you intend to swim. A nearby plume moving toward the beach may become more relevant several hours later. - Combine the map with official information.
Always check bathing-water classifications, temporary municipal restrictions, health-authority notices, beach signage, weather warnings, sea state, and lifeguard indications.
Reading the colors correctly
The WaComM++ visualization uses colors to represent modeled particle concentration. In general, the progression moves from absent or very low concentrations toward low, medium, high, very high, and potentially forbidden levels, depending on the specific legend associated with the product.
The colors should be interpreted comparatively:
- No visible particles or very low modeled concentration: potentially preferable among the locations being compared.
- Low concentration: some modeled particles are present; inspect the following forecast hours and the direction of movement.
- Medium or high concentration: consider another area and verify official bathing information.
- Very high or forbidden range: do not use the model alone to make a safety decision; consult the competent authorities and any official restrictions.
A clear-looking sea is not necessarily uncontaminated, and a colored model cell is not itself proof of measured contamination. WaComM++ predicts transport and diffusion from modeled sources; it does not directly analyze the water at the selected beach.
Comparing candidate swimming areas
Suppose you are deciding among several destinations in the Bay of Naples. Rather than selecting only on the basis of proximity or popularity, you can compare their predicted exposure:
- Does the model show a plume near one destination but not the others?
- Is that plume moving toward or away from shore?
- Does the situation improve later in the morning?
- Is a more exposed coastline benefiting from circulation that renews the local water?
- Is a sheltered inlet retaining modeled particles for several consecutive hours?
The same reasoning can support comparisons between coastal sectors in the Bays of Naples and Salerno, provided that the selected WaComM++ operational product covers the area and contains the relevant modeled sources.
The most useful conclusion is not that one beach is permanently “cleaner” than another. Rather, the model can suggest that, for a specific forecast time and configured scenario, one area appears less exposed to the simulated particle field.
Blue Flags and WaComM++ answer different questions
It would be misleading to use a WaComM++ forecast to challenge or reproduce a Blue Flag assignment directly.
The Blue Flag evaluates a destination through a structured certification process covering water quality, environmental education, environmental management, services, and safety. The recognition is awarded annually, and the criteria must be maintained throughout the season.
WaComM++, by contrast, provides a time-dependent simulation of transport and diffusion. It can help answer questions such as:
- Where may a modeled plume move today?
- Which coastline may be less exposed during the planned swimming period?
- How rapidly could particles disperse under the predicted circulation?
- Would postponing the swim by a few hours improve the modeled conditions?
The two forms of information are therefore complementary. The Blue Flag describes the broader environmental quality and management of a destination; WaComM++ adds a short-term view of the evolving marine circulation.
A practical decision workflow
A responsible choice can follow four stages:
First, shortlist suitable destinations.
Consider official bathing-water status, Blue Flag recognition, accessibility, services, sea conditions, and personal requirements.
Second, inspect WaComM++ output.
Compare the candidate areas at the intended time and over the preceding and following hours.
Third, verify current official notices.
Check for temporary bathing prohibitions, exceptional pollution events, adverse weather, rough seas, jellyfish alerts, or other hazards.
Finally, assess conditions on site.
Respect signage and lifeguard instructions. Avoid swimming near visible discharges, ports, river mouths, stormwater outlets, floating waste, unusual discoloration, or unpleasant odors.
High-performance computing for everyday decisions
WaComM++ was designed to simulate very large populations of particles while remaining suitable for operational forecasting. In the published Gulf of Naples benchmark, the model processed approximately 25 million particles over a 24-hour simulation using a hierarchical combination of distributed-memory processing, shared-memory parallelism, and multiple GPUs. The accelerated particle-computation phase achieved extremely large speedups over the sequential implementation, making computationally demanding coastal forecasts compatible with operational workflows.
This computational capability transforms a complex numerical model into a practical information product. The same technology used for scientific studies, aquaculture planning, and pollutant-dispersion assessment can help citizens better understand the changing coastal environment.
Use the forecast as guidance, not certification
WaComM++ can support a more informed choice of where and when to swim, particularly when comparing multiple destinations. Nevertheless, its output remains a numerical-model forecast and is subject to uncertainties in hydrodynamic predictions, source representation, emission rates, initial conditions, spatial resolution, and physical parameterizations.
The operational maps are generated automatically and are supplied as-is. The meteo@uniparthenope portal explicitly states that their interpretation should be undertaken responsibly, that all displayed times are in UTC, and that the products do not replace official documents.
The cleanest-water strategy is therefore not to rely on a single symbol, map, or color. It is to combine:
long-term environmental recognition, official bathing-water monitoring, short-term WaComM++ forecasts, current public notices, and direct observation of local conditions.
Used in this way, WaComM++ offers a new perspective on a familiar summer decision: not simply which beach should we visit?, but which coastal area appears most favorable at the time when we actually intend to enter the water?