What if, instead of asking how strong the wind will be in Naples tomorrow, we could ask how the wind will change from one side of our racecourse to the other?
For a sailor, wind is never just a number.
It is the darker patch moving across the water. The extra pressure arriving from one side of the course. The unexpected header close to the coast. The few knots that appear just far enough away to make you wonder whether crossing the fleet is worth the risk.
An Optimist sailor learns this very quickly.
You may be eight years old, sitting in one of the smallest racing boats in the world, but after a few days on the water you already understand something quite sophisticated about meteorology:
the wind over the racecourse is not necessarily the same everywhere.
Much later, an America’s Cup sailor flying across the Bay of Naples at several times the speed of that Optimist will be dealing with exactly the same atmosphere.
The boats could hardly be more different.
The question is surprisingly similar.
Where is the best wind?
And that is where Spritz enters our story.
A weather forecast is only the beginning
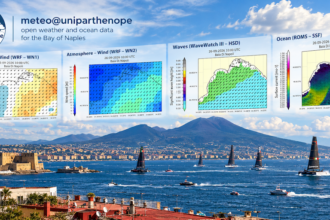
At meteo@uniparthenope we are accustomed to looking at the atmosphere through numerical models.
WRF tells us how the atmosphere is expected to evolve. We can examine wind, temperature, pressure, precipitation, atmospheric stability and many other variables.
For sailing, however, knowing that the Bay of Naples will have, say, a moderate south-westerly breeze is only the beginning.
A racecourse is much smaller than a regional weather map.
And the sailor wants to know what happens inside it.
Is the wind stronger offshore?
Does it weaken approaching the coast?
Is there a persistent band of additional pressure?
Does the direction change across the course?
Will that pattern still be there two hours later?
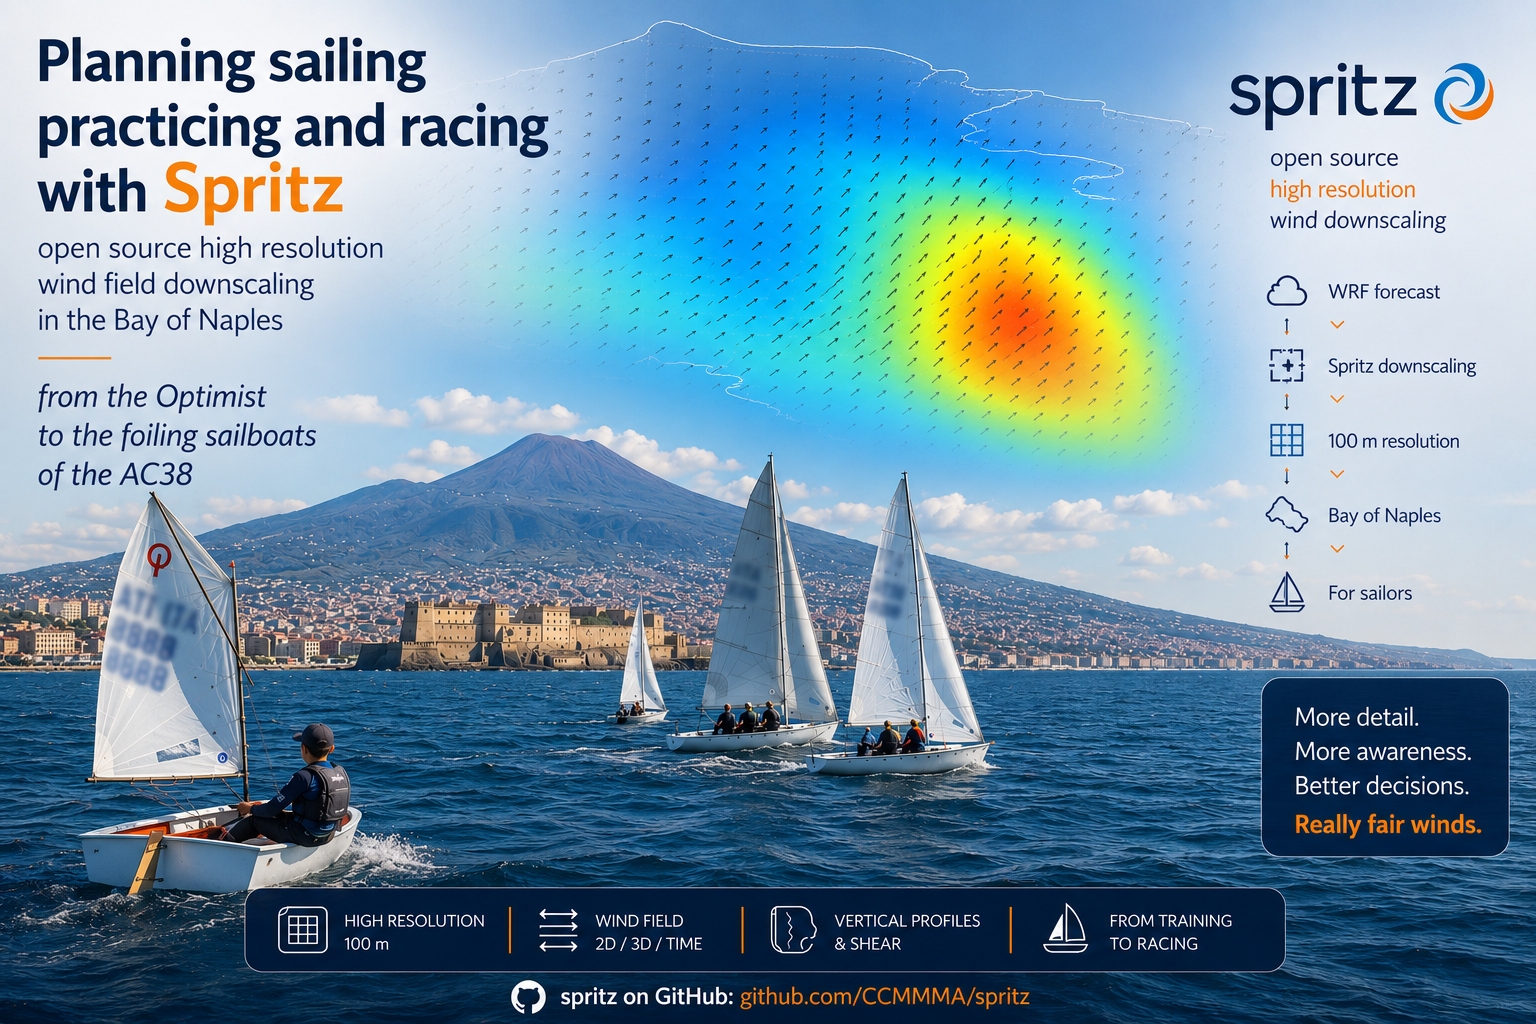
These are precisely the kinds of questions that motivated the high-resolution wind-field downscaling use case of Spritz, the open-source modelling framework developed within the CCMMMA ecosystem.
Spritz takes the meteorological information provided by the parent model and brings it onto a much finer local grid, where terrain and land-cover information can also be considered.
For the Bay of Naples experiment, the demonstrated grid spacing reaches approximately 100 metres.
Suddenly, we are looking at the atmosphere on a scale much closer to the one on which sailing actually happens.
But there is an important scientific caution.
A 100 m grid does not magically make WRF a 100 m weather model.
Spritz performs deterministic diagnostic downscaling. The evolution of the atmosphere still comes from the parent meteorological simulation. The finer grid allows us to investigate local spatial structure in much greater detail, but it does not create atmospheric dynamics that were not resolved by the original model.
That distinction will become important later.
For now, let us go sailing.
A Sunday in June
On 21 June 2026, hundreds of boats took to the Bay of Naples for the 40th Velalonga.
We already used meteo@uniparthenope products to examine the meteorological conditions surrounding the event, combining high-resolution weather and marine forecasts with products intended for sailors and onboard navigation.
Now we can return to those waters with Spritz and ask a different question.
Not simply:
What was the wind forecast for Naples?
But:
What did the modelled wind field look like across the sailing area?
And that changes the perspective considerably.
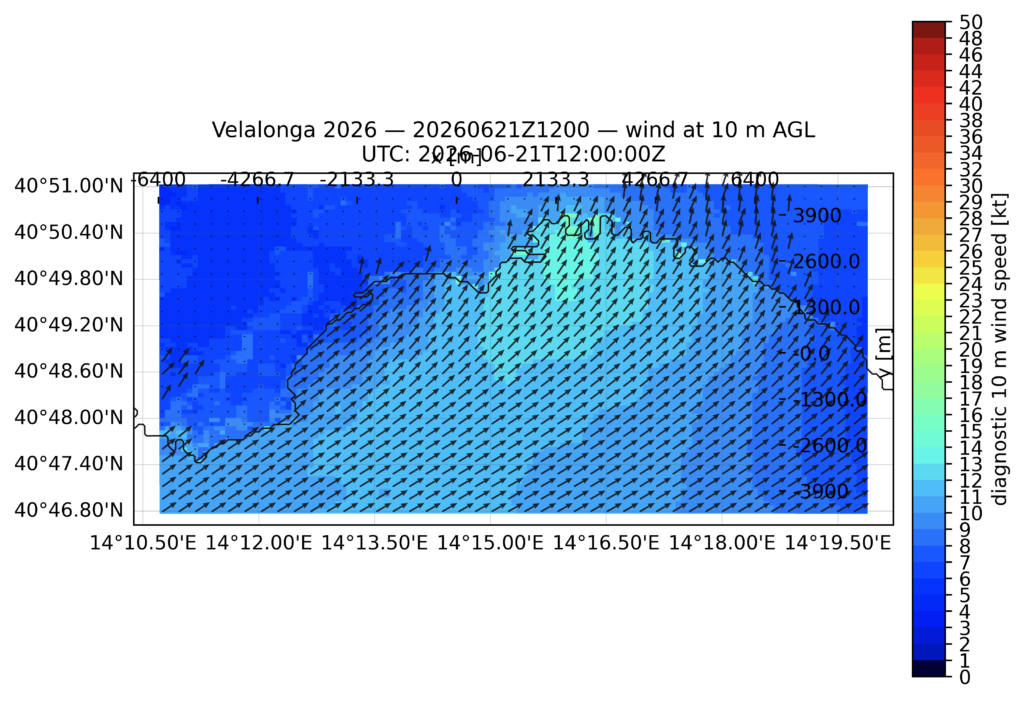
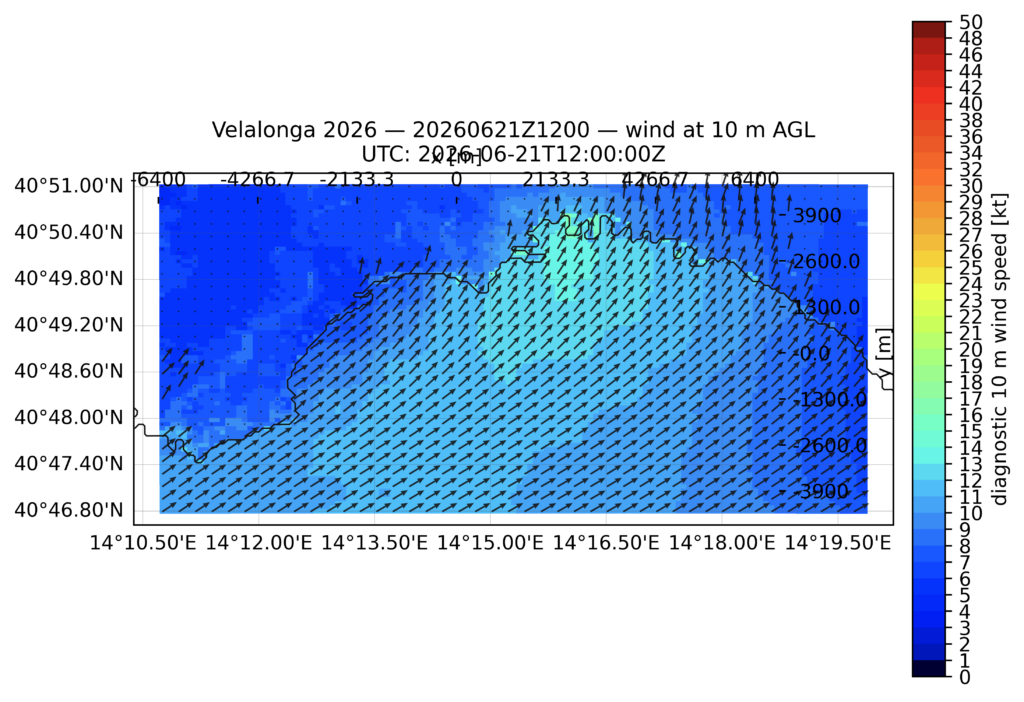
Velalonga 2026, diagnostic 10 m wind field, 12:00 UTC
Look first at the colours.
They represent wind speed.
Then look at the arrows.
They show the horizontal flow.
The interesting thing is not any individual value.
It is the pattern.
Wind speed varies across the domain. The flow is not completely uniform. Stronger and weaker areas coexist within a geographical region that, on an ordinary forecast map, might easily be represented by one symbol and one wind-speed range.
For someone sitting at home deciding whether to take a walk, that may be enough.
For someone trying to sail around a racecourse faster than everybody else, perhaps not.
Now press Play
A single map is useful.
A sequence is much better.
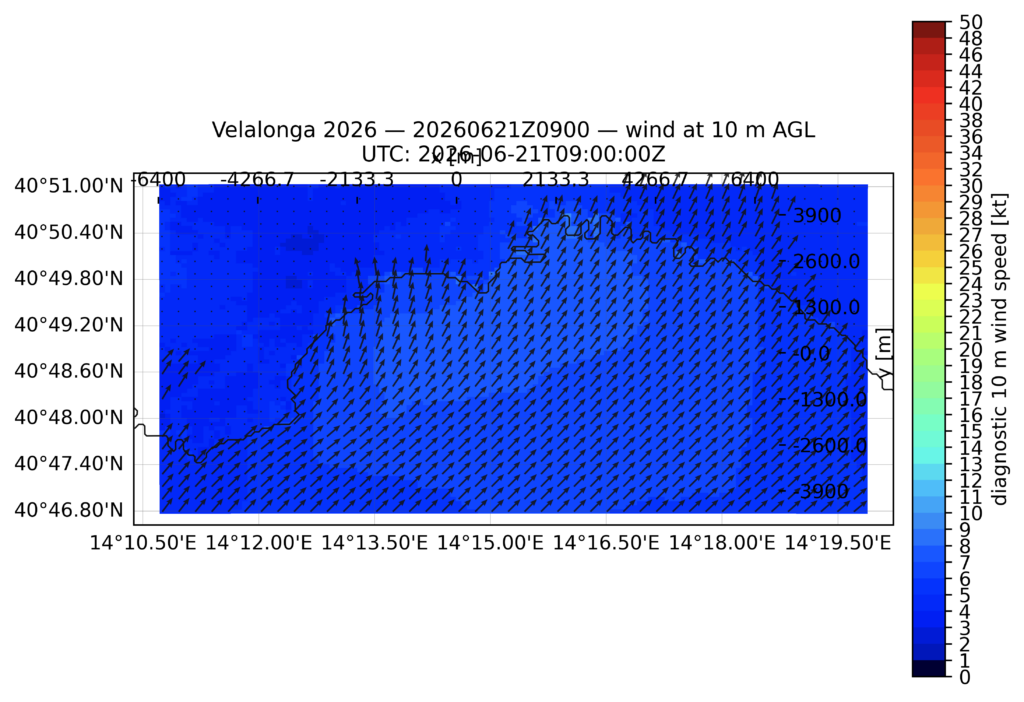
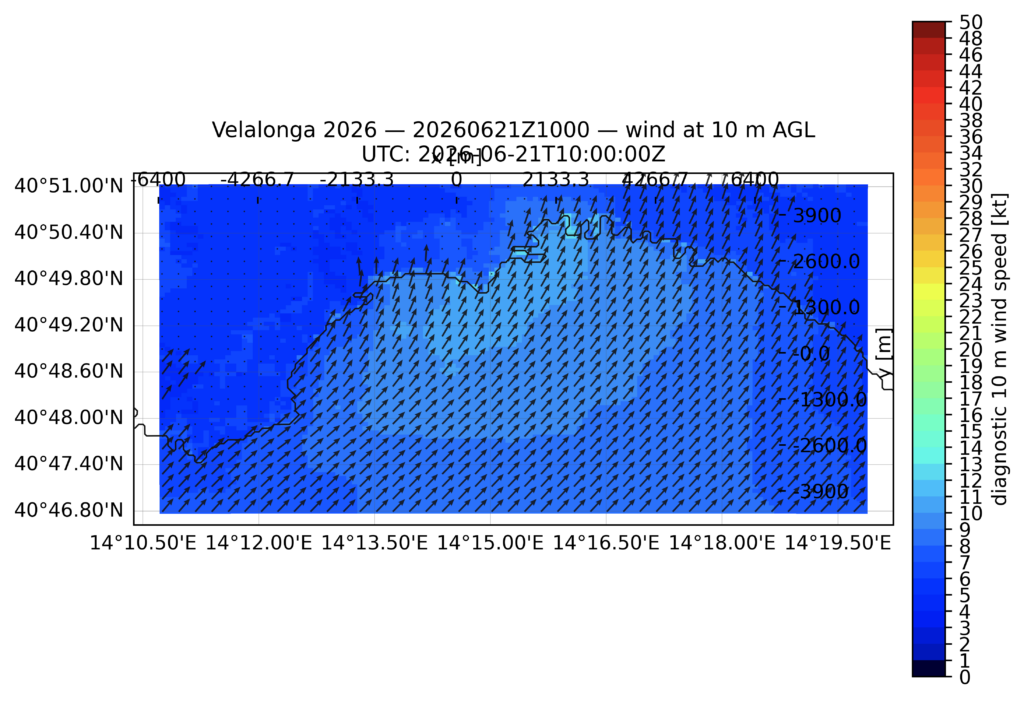
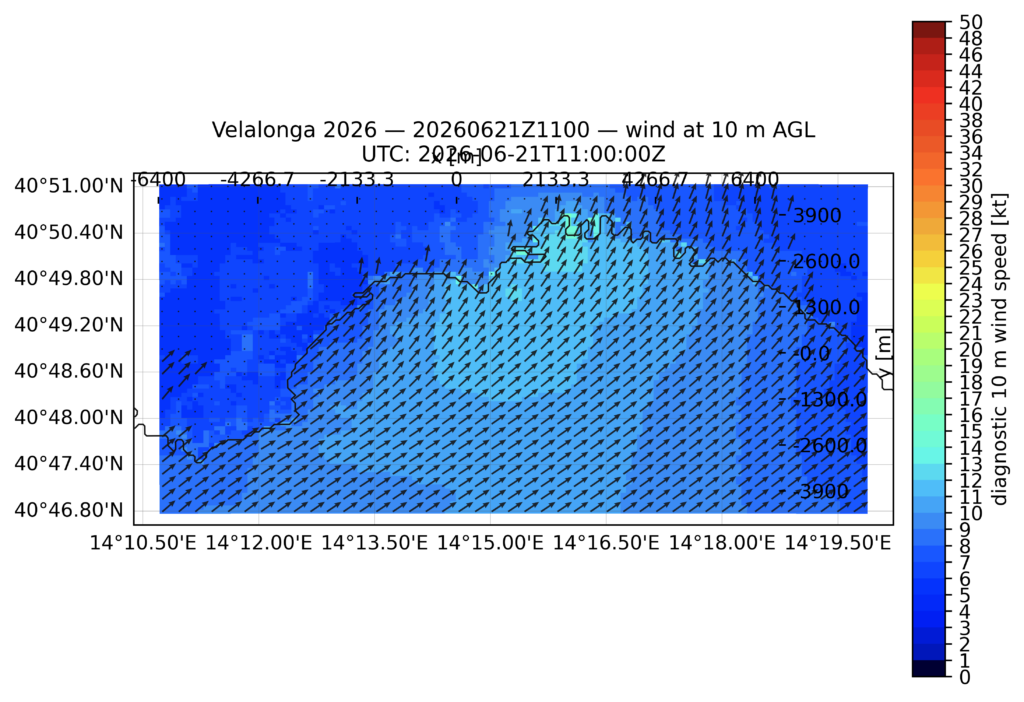
Velalonga 2026, 10 m wind evolution from 09:00 to 14:00 UTC
From 09:00 through 14:00 UTC, the structure changes.
A region of stronger wind develops and evolves over part of the sailing area. Direction changes too. The spatial pattern at 09:00 is not simply the same picture with larger numbers at 14:00.
The atmosphere is moving.
That sounds obvious, but it has an important consequence for racing.
The question is not only:
Where is the stronger wind?
It becomes:
Where will the stronger wind be when my boat gets there?
Now we have moved from weather forecasting toward sailing strategy.
Imagine an Optimist training session
Let us make the problem simpler.
Tomorrow afternoon you are coaching a fleet of Optimists in the Bay.
You have a few hours available and need to position a training course.
A conventional forecast tells you that the afternoon should be suitable for sailing.
Good.
But a high-resolution field can suggest something more.
One part of the available water may be expected to remain relatively homogeneous. Another may lie across a stronger horizontal wind gradient. Conditions may strengthen during the planned training period. A coastal sector may behave differently from the more exposed water farther away.
For a beginner, this can help the coach find an appropriate training area.
For a more experienced sailor, the same information becomes part of the exercise.
Why did the right side gain?
Was there actually more pressure there?
Was it a shift?
Did we observe what the model suggested?
And here the numerical model starts doing something rather nice.
It encourages the sailor to look at the water and test a hypothesis.
The computer does not replace observation.
It gives us something interesting to look for.
The racecourse is a meteorological instrument
As sailors become more experienced, we can turn the reasoning around.
Instead of considering boats merely as users of a weather forecast, imagine them as moving observers of the atmosphere.
A training fleet can put dozens of boats across the same stretch of water.
Each one is moving through a slightly different part of the wind field.
Add properly calibrated meteorological sensors, GPS, heading and time, and sailing begins to resemble a mobile environmental observing network.
This suggests a fascinating possibility for the Bay of Naples:
meteorology can help sailing, while sailing can help meteorology.
The high-resolution forecast predicts a gradient.
The boats cross it.
Measurements tell us whether it was really there.
Repeat this often enough and we can start asking much more demanding scientific questions.
Does Spritz improve the spatial representation of wind compared with the parent forecast?
Under which meteorological situations?
Where does it perform best?
Where does it fail?
Those are questions that can be measured rather than guessed.
But the wind does not stop at ten metres
Most sailing weather maps are horizontal.
The atmosphere is not.
Spritz lets us turn our attention upward.
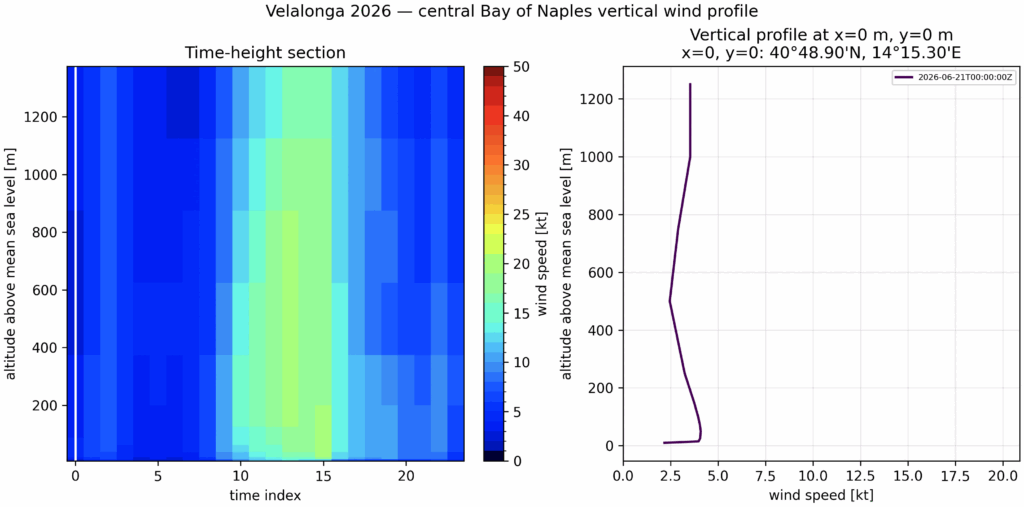
Velalonga 2026, central Bay of Naples vertical wind profile
This time-height diagram follows the wind above a point in the central Bay while the accompanying profile shows how wind speed changes with altitude.
Now the familiar surface wind becomes the bottom of a much deeper atmospheric structure.
This is particularly interesting because what sailors experience at the surface is connected to what is happening above them.
Wind shear, atmospheric stability, vertical mixing and the development of the boundary layer all contribute to the conditions eventually experienced on the racecourse.
This is also why we previously explored Skew-T forecasts for sailing around Naples and Sorrento: sometimes understanding tomorrow’s surface wind means looking well above tomorrow’s sea surface.
Or, put another way:
to understand the wind around the boat, sometimes we have to look above the mast.
Walking into the atmosphere
And now we can do something that feels almost unusual for a sailing forecast.
We can walk around inside it.
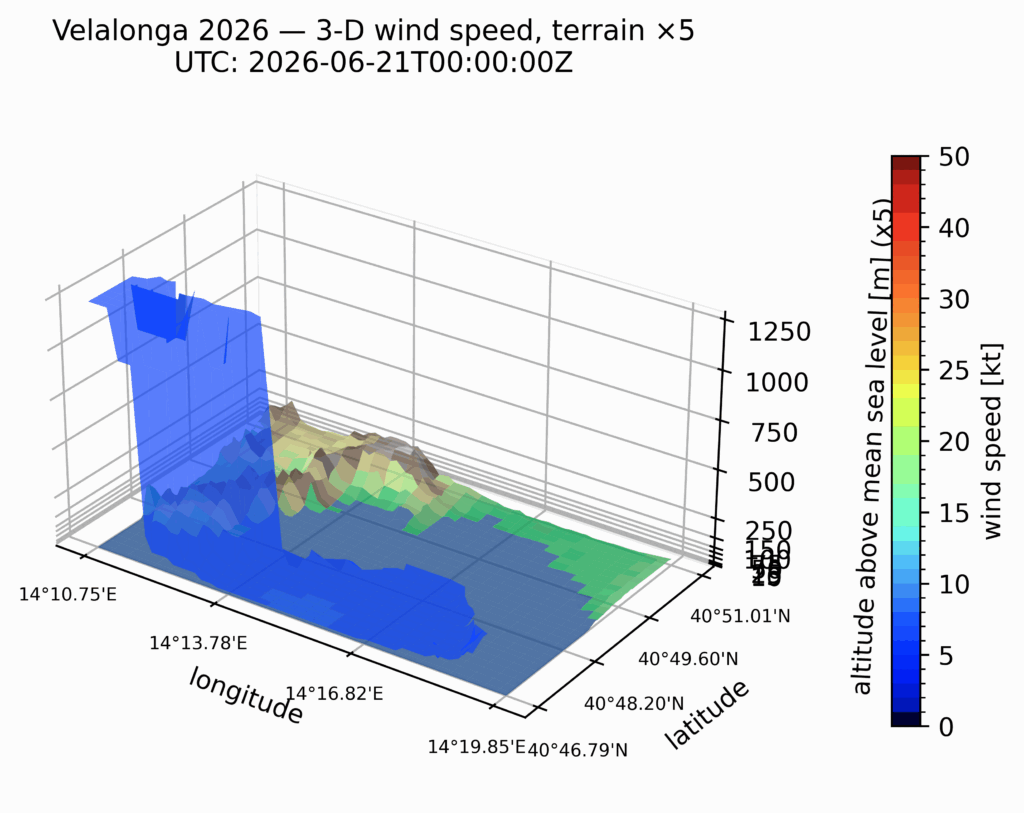
Velalonga 2026, 3-D wind speed with terrain ×5
The terrain is exaggerated vertically here to make the geometry easier to see.
The important feature is the atmosphere above it.
What was previously a coloured two-dimensional map has become a three-dimensional field.
We can go one step further.
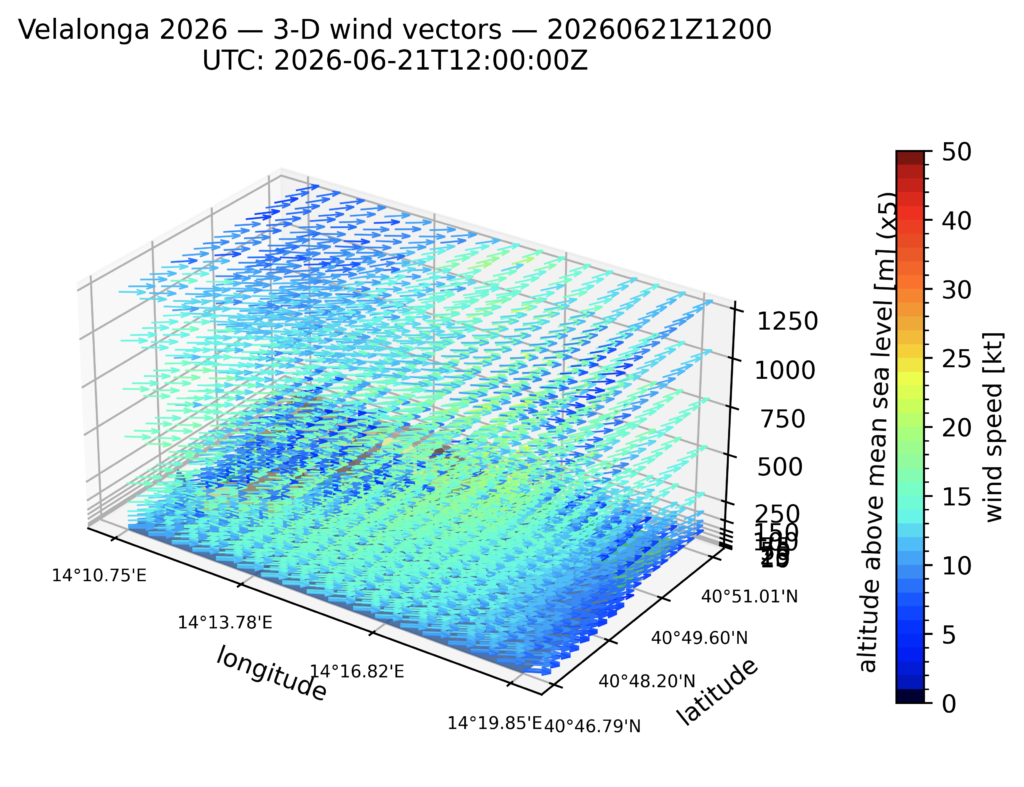
Velalonga 2026, 3-D wind vectors at 12:00 UTC
Now the vectors show the structure of the flow at multiple altitudes.
And one step further again:
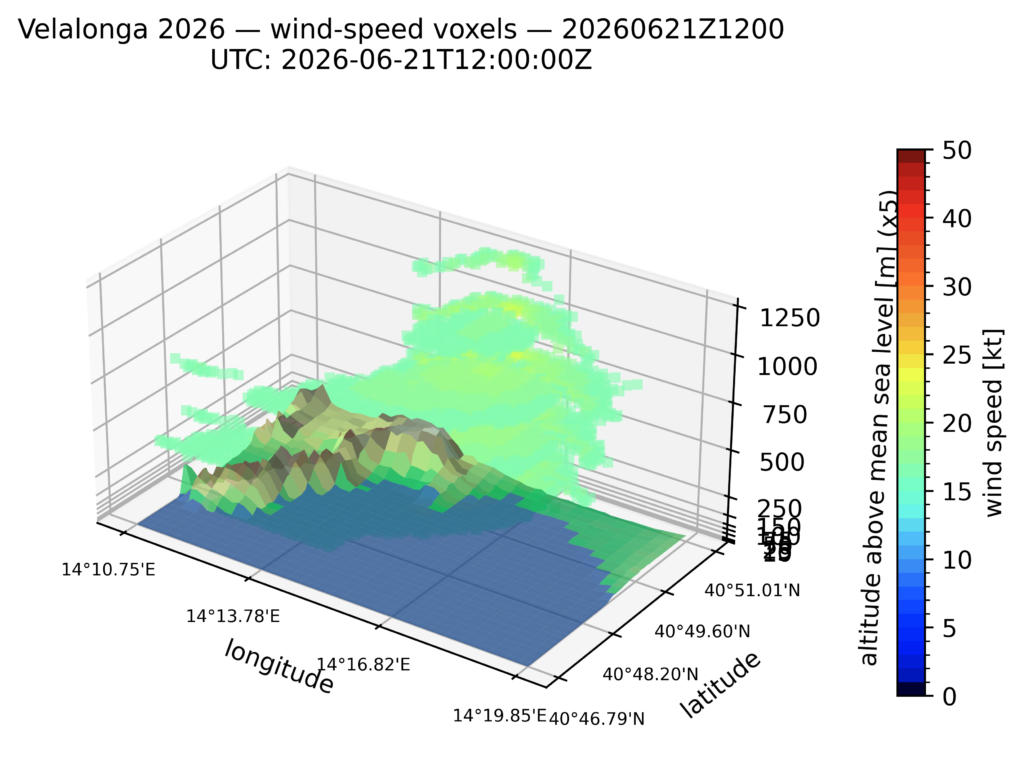
Velalonga 2026, wind-speed voxels at 12:00 UTC
Here the atmosphere is represented almost as a volume.
This is much closer to the mathematical object actually being described.
At every position and time we have a wind vector:
It looks like a compact equation.
For a sailor, however, it has a wonderfully intuitive interpretation.
There is a different wind at different places, heights and times.
And the boat is travelling through it.
The boat does not read a weather map
This is perhaps the most interesting change in perspective.
A weather map is stationary.
A sailboat is not.
Suppose the position of our boat is
As the boat moves, it samples different parts of the atmospheric field.
In other words, the sailor does not really experience the complete map displayed on the screen.
The sailor experiences a trajectory through the forecast atmosphere.
For an Optimist moving at a few knots, that trajectory is relatively slow.
For a high-performance foiling yacht, it most certainly is not.
And now our little Optimist is ready to meet something much bigger.
From eight feet to seventy-five
Imagine two sailors looking across the same Bay.
One is sitting in an Optimist.
The other is aboard an AC75.
The Optimist sailor sees a darker patch on the water and wonders whether she can reach it before the boat beside her.
The AC75 sailor and the surrounding performance team are dealing with aerodynamic loads, foils, apparent wind and a yacht capable of crossing the racecourse at extraordinary speed.
Yet both care deeply about that darker patch.
At 5 knots, a boat needs roughly 39 seconds to travel 100 metres.
At 30 knots, about 6.5 seconds.
At 50 knots, less than 4 seconds.
So even the meaning of “high resolution” begins to depend on what is sailing through the grid.
A 100 m atmospheric feature that persists for a meaningful period of an Optimist leg can be crossed by an AC75 in a handful of seconds.
And that gives us another useful scientific warning:
a finer grid is not automatically a better description of every atmospheric phenomenon.
We must always ask which scales are physically resolved, which are diagnostically represented, and which remain below the capabilities of the model.
And in 2027, the AC75s come to Naples
This is where the story becomes particularly exciting.
The 38th America’s Cup will be contested in Naples in 2027, placing the AC75s in the same Bay we are using as our atmospheric laboratory.
For Naples, this is much more than an extraordinary sporting event.
It is also an extraordinary opportunity for marine meteorology.
Imagine combining high-resolution WRF forecasts, Spritz downscaling, coastal and offshore observations, racecourse geometry and measurements collected on the water.
Then ask questions specifically relevant to high-performance sailing.
Where are the persistent wind-speed gradients?
How does direction change across the racing area?
How quickly does a stronger corridor move?
How does the coastal boundary layer evolve during the racing window?
How well does the morning forecast reproduce what is actually measured during the afternoon?
And, perhaps most importantly for us as scientists:
how much useful information does high-resolution diagnostic downscaling add?
That question should never be answered merely by looking at a beautiful map.
It should be tested.
More pixels are not more truth
This deserves saying clearly.
The Spritz images are detailed.
Some are also rather beautiful.
But neither beauty nor resolution guarantees meteorological truth.
The Spritz product remains derived from a numerical forecast. Its fine spatial grid must always be interpreted in relation to the parent WRF model, the downscaling methodology and the observations available for verification.
That is not a weakness peculiar to Spritz.
It is simply how responsible numerical modelling works.
We forecast.
We observe.
We compare.
We learn where the model succeeds and where it does not.
And then we improve it.
This is consistent with the broader philosophy already used in meteo@uniparthenope applications: model products contribute to situational awareness and decision support, while observations, official information and human expertise remain essential.
From weather maps to sailing intelligence
There is therefore an interesting path ahead:
WRF → Spritz → observations → racecourse → boat trajectory → sailing diagnostics
The result does not need to be another complicated meteorological display.
Quite the opposite.
A coach might simply want to know where conditions are expected to be most suitable for today’s training.
A race committee might be interested in how homogeneous the wind field is around a proposed course.
A sailor might want to compare the expected evolution of pressure on opposite sides of the first beat.
A researcher might want every grid point, every vertical level and every observation.
An America’s Cup meteorological team might want to combine atmospheric information with an entirely different level of performance analysis.
Same atmosphere.
Different questions.
The best instrument may still be the sailor
After all these grids, vectors, voxels, models and equations, it is worth returning to the simplest observation of all.
A sailor looks upwind.
She watches the boats ahead.
She looks at the texture of the water.
She feels a change in pressure.
She notices that one cloud is growing while another is disappearing.
She remembers what happened in approximately the same place yesterday.
No numerical model contains all of that information.
But the sailor cannot see tomorrow’s atmosphere either.
That is why the two work so well together.
The forecast tells us what to look for.
The water tells us what is actually happening.
And experience helps us decide what to do about it.
One Bay, many boats, one atmosphere
There is something rather lovely about following this idea all the way from an Optimist to an AC75.
The boats become faster.
The sails become more sophisticated.
The sensors multiply.
Hydrodynamics turns into foiling.
The computational analysis becomes enormously more complex.
But the Bay remains the Bay.
And the wind remains wonderfully indifferent to whether the sailor underneath it is eight years old or competing for the America’s Cup.
Spritz gives us a new open-source way to investigate that wind: horizontally across the course, vertically through the atmosphere, and through time as the forecast evolves.
Not to tell sailors what decision to make.
Not to replace the eye looking at the water.
And certainly not to pretend that a 100 m grid gives us perfect knowledge of every gust.
But to ask better questions.
Where will the pressure build?
How will the wind change across the course?
What is happening above us?
And does what we observe agree with what we predicted?
Those questions can begin during an Optimist lesson.
They can continue through club and Olympic racing.
And soon, here in Naples, they can accompany some of the fastest and most technologically advanced sailing boats ever built.
From the smallest racing dinghy to an AC75 flying across the Bay, there is one piece of equipment that every sailor would still like to have:
a slightly better idea of where the wind is going to be.
Have great dreams, study the wind, keep looking at the water — and really fair winds.
Cloudia Fairwinds
Spritz and reproducibility
Spritz is an open-source modelling framework developed within the CCMMMA ecosystem. The source code and the reproducible high-resolution wind-field use case are publicly available:
Spritz
https://github.com/CCMMMA/spritz
High-resolution wind-field use case
https://github.com/CCMMMA/spritz/tree/main/usecases/01_high_resolution_wind_field
The use case demonstrates the production of high-resolution diagnostic meteorological fields from WRF forcing together with terrain and land-cover information. The resulting products can be explored as horizontal maps, vertical profiles and three-dimensional atmospheric fields.
A note for sailors
The maps and derived products discussed in this article are numerical-model guidance and experimental diagnostic products. They are not observations and do not replace official forecasts, weather warnings, notices to mariners, race-committee instructions or the judgement of the skipper and crew.
For sailing, the most useful forecast is the one that is continually compared with the sky, the sea and the instruments around you.