In high-level sailing, a weather forecast is not merely a prediction of wind speed and direction. It is part of the race strategy.
A few degrees of wind shift can determine which side of the course pays. A shallow stable layer can delay the sea breeze. An unstable atmosphere can produce stronger gusts, rapidly changing pressure and localised showers. Wind shear above the surface may reveal what the wind is likely to do later, even when the racecourse still appears calm.
The Skew-T log-P diagram helps sailors, coaches and race meteorologists examine these processes by showing the atmosphere vertically, from sea level to the upper troposphere.
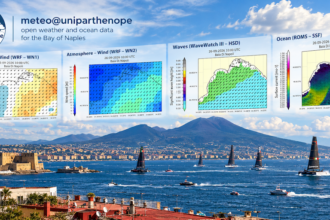
The WRF forecasting system operated by meteo@uniparthenope makes this type of analysis available for selected coordinates and forecast times. WRF is a mesoscale numerical weather-prediction model designed for both operational forecasting and atmospheric research, while the associated Skew-T product represents temperature, humidity, stability and wind throughout the atmospheric column.
This capability is especially relevant to two internationally important sailing areas:
- the Bay of Naples, which will host the Louis Vuitton 38th America’s Cup in 2027;
- the Bay of Sorrento, where the 2026 IMA Maxi European Championship was recently contested as part of the Tre Golfi Sailing Week.
Why the vertical atmosphere matters to sailors
A conventional marine forecast normally describes conditions close to the surface: wind at 10 metres, significant wave height, precipitation and atmospheric pressure.
A Skew-T adds a different dimension. It answers questions such as:
- Is the lower atmosphere well mixed or stratified?
- Is the sea breeze likely to deepen during the afternoon?
- Can stronger wind above the surface descend to the racecourse?
- Is there an inversion that may suppress or redirect the local circulation?
- Is convection possible?
- Are showers or thunderstorms capable of producing sudden shifts and gust fronts?
- Does wind direction rotate significantly with height?
For a racing team, these are not abstract meteorological questions. They affect sail selection, course positioning, manoeuvre planning, foil configuration, crew workload and risk management.
The essential elements of a Skew-T
At first sight, a Skew-T may appear complex because several families of lines are presented on the same graph. A sailor does not need to become an atmospheric scientist to extract useful information, but some basic elements must be recognised.
Pressure and altitude
The vertical axis shows atmospheric pressure in hectopascals. Pressure decreases with altitude:
- values near 1000 hPa represent conditions close to sea level;
- approximately 850 hPa corresponds to the lower atmosphere;
- 700 hPa and above describe progressively higher levels.
For racing applications, the lowest portion of the diagram is often the most immediately relevant, but higher layers are important when evaluating instability and convective development.
Temperature
The red profile normally represents forecast air temperature.
Because temperature lines are tilted on a Skew-T, the curve must be read against the diagonal isotherms rather than vertically. The way temperature changes with height indicates whether the atmosphere is stable, neutral or unstable.
Dew point
The green profile represents dew-point temperature and therefore provides information about atmospheric moisture.
When the temperature and dew-point curves are close together, the air is relatively humid and cloud formation is more likely. When they are widely separated, the layer is comparatively dry.
Wind barbs
Wind barbs along the right side of the diagram show forecast wind direction and speed at different pressure levels.
For sailors, they provide a quick view of:
- changes in direction with height;
- increases or decreases in wind speed;
- low-level wind maxima;
- layers containing stronger momentum that could mix toward the surface.
Stability indices
Many Skew-T products include numerical indices such as:
- CAPE, Convective Available Potential Energy;
- CIN, Convective Inhibition;
- K Index;
- Total Totals Index.
These values help assess atmospheric instability, but they must never be interpreted in isolation. The entire vertical profile, the forecast time, the position of the sounding and the local circulation must be considered together.
An example over the Bay of Naples
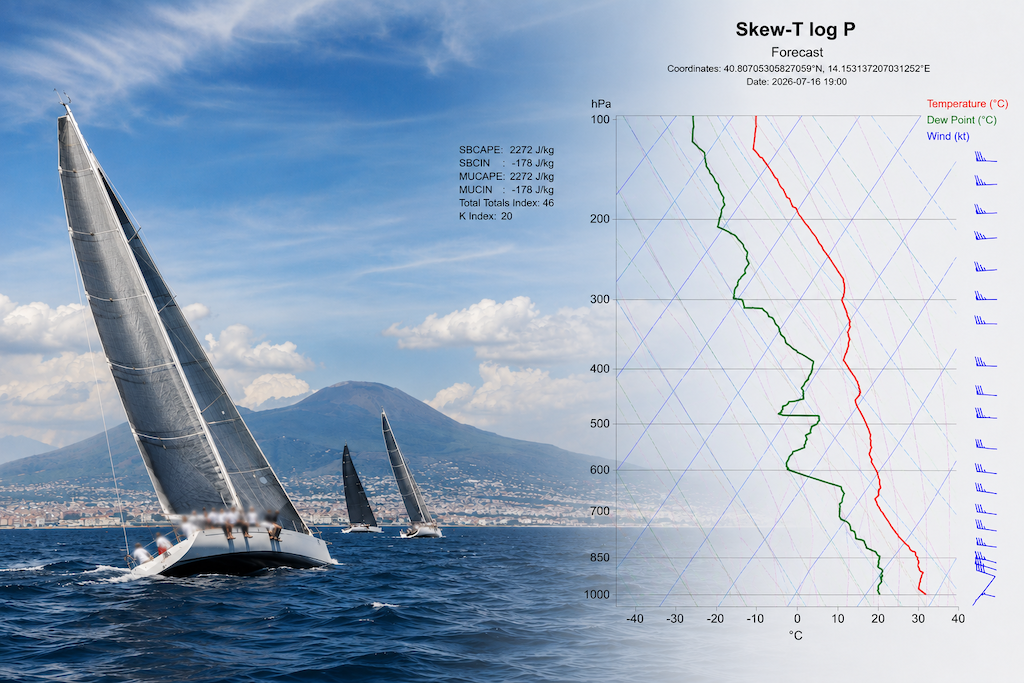
The meteo@uniparthenope API can generate a Skew-T for a selected WRF forecast time and geographical point. One example, centred near the western sector of Naples at 40.807° N, 14.153° E, describes the forecast atmospheric column for 16 July 2026 at 19:00 UTC.
The diagram reports:
- SBCAPE: 2272 J/kg
- SBCIN: −178 J/kg
- MUCAPE: 2272 J/kg
- MUCIN: −178 J/kg
- Total Totals Index: 46
- K Index: 20
These values describe an atmosphere with substantial potential instability but also with inhibition that may initially limit surface-based convection. This does not mean that a thunderstorm will necessarily occur over the racecourse. It means that the atmosphere may contain considerable energy if a lifting mechanism is able to overcome the inhibiting layer. The temperature, moisture and wind profiles must therefore be evaluated together with WRF maps, radar or satellite observations and local measurements.
For a sailing team, such a profile would justify particular attention to:
- the evolution of cloud fields over the surrounding relief;
- convergence between the marine breeze and inland flows;
- possible outflow boundaries from distant convective cells;
- sudden wind increases or directional changes;
- the difference between conditions at the starting area and those closer to the coast.
Application to the Bay of Naples and AC38
The 38th America’s Cup is scheduled to take place in Naples in 2027, with the Match intended to begin on 10 July. The official event description places the racing off the Naples waterfront, beneath Mount Vesuvius, in a coastal environment where land–sea thermal contrasts and surrounding topography can strongly influence the wind.
The Bay of Naples is not an aerodynamically uniform basin. Its wind field may be affected by:
- the urbanised coastline;
- the Posillipo headland;
- the Phlegraean area;
- Mount Vesuvius;
- the Sorrentine Peninsula;
- the islands of Capri, Ischia and Procida;
- differences in sea-surface and land temperature;
- channelled or deflected flows near headlands.
A surface wind map can show the predicted result of these interactions. The Skew-T helps explain the atmospheric environment in which they develop.
Anticipating sea-breeze onset
Before the sea breeze becomes established, the surface layer may be weakly ventilated or affected by residual land flow. The Skew-T can reveal whether a stable layer or inversion is likely to resist vertical mixing.
A strong low-level inversion may delay the arrival of the more organised marine flow. A weaker inversion and rapid daytime heating may favour an earlier transition.
For the team, this can influence:
- expected start-time conditions;
- selection of sails and foils;
- whether to expect a light-air setup followed by a rapid increase;
- the likely duration of oscillating or patchy pre-breeze conditions.
Estimating mixing and gust potential
When the lower atmosphere becomes well mixed, momentum from several hundred metres above the sea may be transported downward.
If the wind profile shows stronger flow immediately above a developing mixed layer, surface wind may increase during the afternoon. Gusts may also become more pronounced.
A team can use this information to determine whether the wind shown at 10 metres represents a stable upper limit or merely the current surface expression of a stronger flow aloft.
Examining directional shear
A change of wind direction with height can indicate that the surface circulation is still shallow.
For example, the lowest layer may contain a local sea breeze while the atmosphere above it retains a broader synoptic flow from another direction. As mixing deepens, the balance between the two can change.
This may produce:
- a persistent afternoon veer or backing trend;
- different pressure on opposite sides of the course;
- variations between an offshore mark and a mark closer to the coast;
- periods when one side receives the new wind first.
On fast foiling boats, recognising these transitions early is crucial. The objective is not simply to sail toward the strongest present wind, but to position the boat for the wind field that is about to dominate.
Application to the Bay of Sorrento
The waters off Sorrento hosted the 2026 IMA Maxi European Championship from 21 to 28 May, combining the long-distance Regata dei Tre Golfi with coastal and inshore racing. Reports from the event describe tactical racing in light and shifting conditions, illustrating the importance of local meteorology in this area.
The Bay of Sorrento presents a different—but equally complex—setting from the Naples waterfront.
The steep terrain of the Sorrentine Peninsula can:
- generate local upslope and downslope circulations;
- create shadows and acceleration zones;
- modify the timing of the sea breeze;
- deflect winds around coastal promontories;
- produce strong spatial gradients over relatively short distances.
Identifying a shallow coastal breeze
A Skew-T showing a rapid change in wind direction just above the surface may indicate that the coastal breeze is confined to a shallow layer.
In this situation, the local wind can be highly sensitive to heating, cloud cover and position relative to the shoreline. The breeze observed near Sorrento may not extend uniformly toward the centre of the Gulf.
The tactical implication is clear: a boat should not assume that pressure visible close to land will propagate unchanged across the entire course.
Detecting stable evening transitions
Late-afternoon and evening races can encounter rapid stabilisation as the land cools.
When the surface layer loses heat, vertical mixing weakens. Stronger wind aloft may become disconnected from the sea surface, causing:
- a sudden reduction in surface wind;
- increased patchiness;
- greater influence from terrain-driven drainage flows;
- local directional shifts near the coast.
Comparing Skew-T profiles from consecutive forecast hours can help estimate when this decoupling is likely to begin.
Evaluating convective influence from the peninsula
Clouds developing over the peninsula may alter the coastal pressure field even when precipitation does not reach the racecourse.
A deepening humid layer and increasing instability can signal the potential for:
- enhanced convergence;
- localised acceleration;
- outflow from inland showers;
- temporary suppression or displacement of the marine breeze.
For offshore and coastal courses, the consequences may extend well beyond the visible cloud base.
A practical workflow for race preparation
The greatest value comes not from looking at a single diagram, but from comparing several Skew-T profiles in space and time.
1. Select representative points
Generate profiles for locations such as:
- the expected starting area;
- the windward side of the course;
- the leeward side;
- a point closer to the coastline;
- a point farther offshore;
- the Naples and Sorrento sectors when evaluating a long coastal route.
A Skew-T represents one atmospheric column. It should not be assumed to describe the entire Gulf.
2. Compare consecutive forecast hours
Examine profiles before, during and after the scheduled racing window.
Look for:
- erosion or formation of an inversion;
- deepening of the mixed layer;
- increasing low-level wind;
- directional rotation;
- growing low-level moisture;
- changing convective indices.
The trend is often more valuable than any single value.
3. Combine Skew-T and horizontal WRF maps
The vertical profile should be interpreted alongside the WRF forecast maps available from the meteo@uniparthenope place pages.
Horizontal products show where wind gradients and convergence zones are expected. The Skew-T explains whether the atmosphere is likely to support, suppress or modify those surface patterns.
4. Validate the forecast on race day
Compare model output with:
- onboard instruments;
- committee-boat measurements;
- coastal weather stations;
- visual cloud observations;
- satellite and radar products;
- reports from coach boats around the course.
Differences between the model profile and observations are operationally important. They may indicate that a transition is occurring earlier or later than forecast.
5. Convert meteorology into decisions
The final briefing should translate atmospheric information into racing consequences.
Instead of saying:
“There is a low-level inversion at 900 hPa.”
The briefing should say:
“The sea breeze may remain shallow during the first race. Pressure close to shore could be stronger but less persistent, while the central course may receive the new breeze later.”
Instead of saying:
“The profile contains directional shear.”
The team should hear:
“The surface wind is expected to veer as mixing increases. Protect the right side during the transition, but reassess after the marine layer becomes established.”
A compact Skew-T checklist for sailors
Before leaving the dock, ask:
- Are temperature and dew point close in the lowest layers?
- Is there a low-level inversion?
- How deep is the expected mixed layer?
- Is the wind stronger immediately above the surface?
- Does wind direction change significantly with height?
- Is instability increasing during the racing period?
- Are CAPE and inhibition consistent with possible convection?
- Do nearby points show the same atmospheric structure?
- Does the latest observation confirm the model?
- What tactical consequence follows from each meteorological signal?
What a Skew-T cannot tell you alone
A Skew-T is a powerful diagnostic tool, but it is not a complete race forecast.
It does not directly resolve every wind bend around a headland, every wake behind an island or every short-lived patch of pressure. Nor does it replace observations, official warnings, race-committee decisions or professional meteorological interpretation.
The meteo@uniparthenope products are generated automatically using numerical weather-prediction methods. Forecast times are expressed in UTC, and the products are supplied as research and informational outputs rather than substitutes for official forecasts or safety documentation.
From weather map to competitive advantage
The best racing decisions come from understanding not only what wind is forecast, but why it is expected to develop.
In the Bay of Naples, this means anticipating how the marine layer will interact with the metropolitan coastline, the Phlegraean area, Vesuvius and the Sorrentine Peninsula. In the Bay of Sorrento, it means recognising how steep terrain, coastal heating and local circulations can create major differences across a compact race area.
The Skew-T diagram provides the vertical context behind these processes.
Used together with high-resolution WRF maps, observations and on-water experience, it can help a team anticipate:
- when the sea breeze will establish;
- whether it will remain shallow or deepen;
- whether stronger wind aloft can reach the surface;
- whether the wind will veer or back;
- whether cloud development could disturb the racecourse;
- where and when the most reliable pressure is likely to appear.
In yacht racing, the atmosphere is part of the course. Reading it vertically can turn a forecast into a tactical plan.